

Sales dashboard
Sales, targets, pipeline, and performance by sales rep.
Sales management software developmentWe build business dashboards that pull data from your systems (sales, inventory, accounts receivable, operations, marketing) into clear dashboards that update automatically. Leadership stops waiting for manually built reports and makes decisions with today's numbers, from a computer or a phone.
Updated:
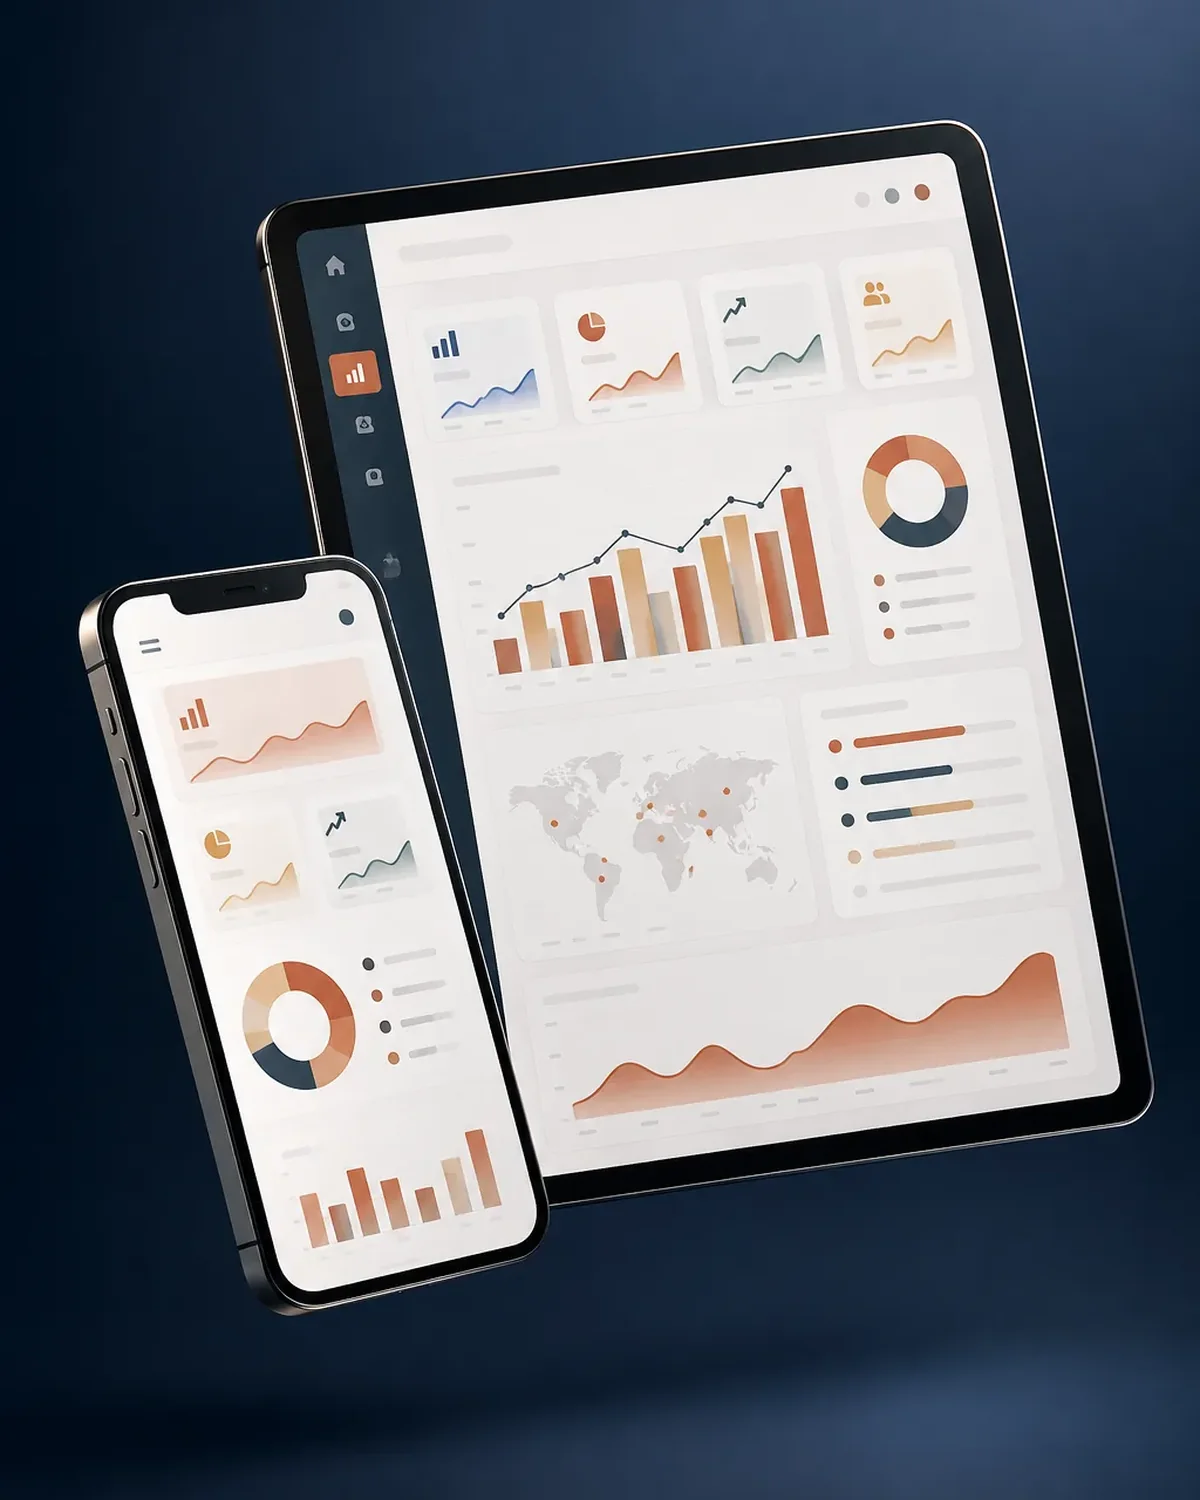
Make decisions with today’s numbers
10 years building for businesses
Each department needs to see different things.
Sales, targets, pipeline, and performance by sales rep.
Sales management software developmentCash flow, receivables, expenses, and profitability.
Internal financial management software developmentProduction, shipping, lead times, and on-time delivery.
Campaigns, customer acquisition cost, and return on investment.
From deciding what to measure to getting the dashboards up and running.
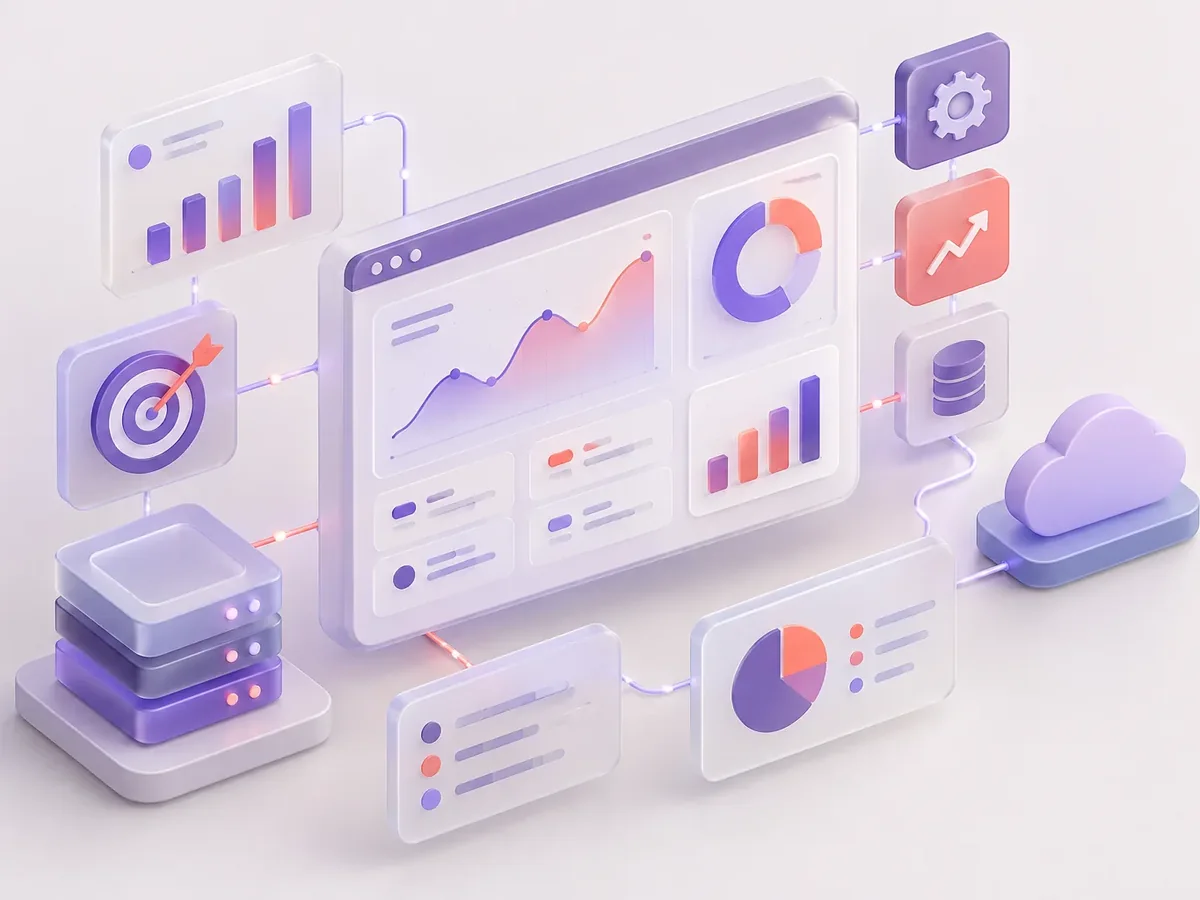
We work in short stages, with deliverables you can test. You always know what’s being built, what’s left, and what we need from your team.

We interview the departments that will use the system and map how information flows today.
You: show us how you work today
You get: a process map and scope
We design the main screens in a clickable prototype to validate them before writing code.
You: test the prototype with your team
You get: an approved prototype
We build and deliver module by module, so your team can start using it soon.
You: test each module
You get: working modules in testing
We load your current data, train each role, and support you through launch.
You: hand over your databases
You get: a live system and user manuals
We measure actual usage and make any needed adjustments during the support period.
You: report adjustments through the support channel
You get: a usage and improvements report
Three questions to find out whether you need a KPI dashboard, a modernized version of your current software, or an internal financial system.
We recommend
A business dashboard
We recommend
Modernize your current software
We recommend
Internal financial management software
The metrics we’re asked for most, by industry.

Sales by store, average ticket, and inventory turnover.
Occupancy, appointment availability, and revenue by service.
Enrollment, dropout rates, tuition collection, and academic results.
Building reports by hand takes days and reaches decision-makers too late.
How long does it take your team to put together the management report? We’ll show you how to have it ready every morning.
Can’t find your question?
Message an advisor and we’ll get back to you during business hours (Bogotá time, UTC-5).
It depends on your case. We can build the dashboard inside your web platform or work with tools like Power BI or Looker Studio if you already use them.
From your current systems via API, a database connection, or files that load automatically.
Yes, the dashboards are responsive and can be viewed on any device.
Part of the job is cleaning and consolidating it; we tell you what to fix at the source so the information is reliable.
It’s also searched for as an executive dashboard, KPI dashboard, or business intelligence. The service is related to dashboards, business intelligence, Power BI, KPIs, and data warehousing, topics we review with you when the project calls for them.
What clients most often add to this project.
Tell us which metrics you want to see, which systems hold the data, and who will use them.
We reply during business hours (Bogotá time, UTC-5), usually the same day.