
Ad campaign analytics for US businesses
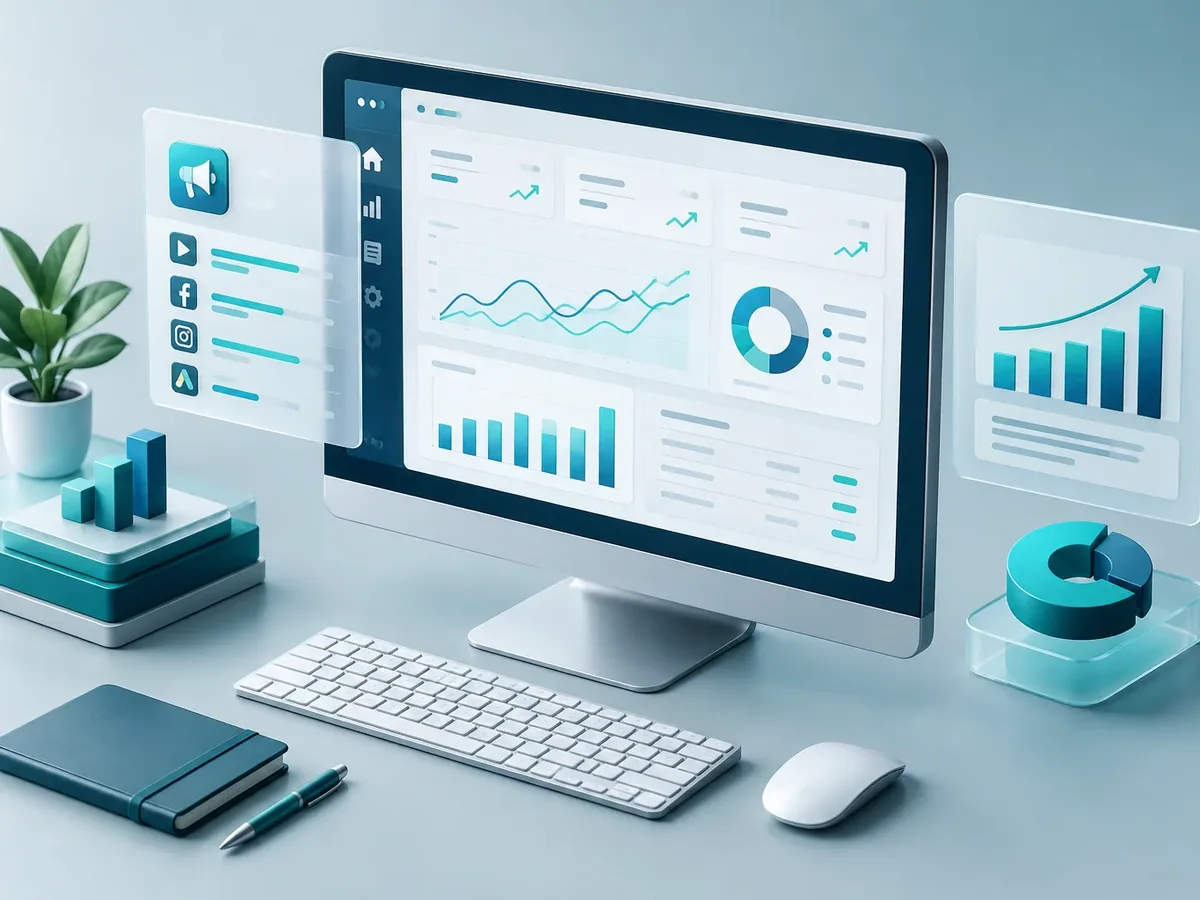
Every ad platform tells its own story and takes credit for the results. We bring together data from Google Ads, Meta, LinkedIn, GA4, and your CRM in one clear dashboard, with spend, leads, sales, and cost per customer by channel and campaign. And we help you interpret it so you can make decisions.
Updated:
- All your channels in one dashboard
- From click to sale
- Reports you can understand

Decide with clear data
10 years building for businesses
What campaign analytics includes
Unified, explained data.
Integration
- Google Ads, Meta, LinkedIn, and GA4.
- CRM or sales data.
- Automatic updates.
Dashboard
- Spend, leads, and sales.
- Cost per lead and per customer.
- Period-over-period comparisons.
Interpretation
- Monthly results meeting.
- Findings and recommendations.
- Alerts on major changes.
How we build your analytics
Before you spend a single dollar, we set up proper tracking and define who we’re talking to and what counts as a result. Then we launch, optimize every week, and report to you in plain language.

-
Step 1: Assessment
We review your business, your competitors, your current accounts, and what a customer is worth to you.
You: give us access to your accounts
You get: an assessment and measurable goals -
Step 2: Tracking
We set up conversions, pixels, and Google Tag Manager to track forms, phone calls, and WhatsApp.
You: agree with us on what counts as a conversion
You get: working conversion tracking -
Step 3: Strategy and ads
We define audiences, keywords, and budget, and we create the ads.
You: approve the copy and creatives
You get: campaigns ready to launch -
Step 4: Launch and optimization
We launch and adjust bids, audiences, ads, and budget every week.
You: tell us about lead quality
You get: documented optimizations -
Step 5: Report and decisions
We show you cost per lead and per customer, and what to do next month.
You: review the report with us
You get: a clear monthly report
Dashboards we build
Based on who uses them.
-
Executive dashboard
Key metrics in one view.
-
Marketing dashboard
Details by channel and campaign.
-
Sales dashboard
Leads and sales by source.
Separate platform reports or unified analytics
Adding up each platform’s results shows more sales than actually happened.
| Aspect | Separate reports | PACOWEB unified analytics |
|---|---|---|
| Source | Each platform. | One integrated dashboard. |
| Attribution | Double-counted. | Consistent. |
| Sales | Not connected. | Connected to the CRM. |
| Time | Hours spent building reports. | Automatic updates. |
Hard to tell which channel brings in customers? Let’s build your dashboard.
What do your current campaigns need? Find out in a minute
Four questions to tell whether the problem is tracking, optimization, budget, or strategy.
We recommend
Remarketing
We recommend
Campaign optimization
We recommend
Conversion tracking
We recommend
Campaign analytics
We recommend
Meta Ads audit
Analytics by business type
Who uses it most.

Marketing teams
Reports for leadership.
E-commerce
Profitability by channel and product.
B2B companies
From lead to opportunity.
Ad campaign analytics FAQ
What tool do you use for dashboards?
Mainly Looker Studio, because it’s free and flexible; we can also work with Power BI if you already use it.
Do I need GA4?
Yes. We recommend having GA4 properly set up as the foundation.
Can sales data be included?
Yes, by connecting your CRM or a sales spreadsheet.
How often is it updated?
Usually daily, automatically.
What other names are used for campaign analytics?
Also known as digital advertising reports, a marketing dashboard, or paid media reports. It’s related to Google Analytics 4, Google Tag Manager, conversions, ROAS, and A/B testing, topics we review with you when the project calls for them.
Can’t find your question?
Related services
Services that often complement this campaign.
Which of these services do you need?
Tracking and conversions: these services are related, but they solve different problems. Choose based on what you need.
- If you need to track every form, phone call, and purchase accurately: Conversion tracking with Google Tag Manager
- If you need to analyze behavior and raise your conversion rate: Digital analytics and conversion rate optimization (CRO)
- If you need reports on how your paid campaigns perform: Ad campaign analytics (you are here)
Get a quote for campaign analytics
Tell us which channels you invest in and who needs to see the results.
- 1You contact us through the form or on WhatsApp.
- 2We talk about your business and what you need.
- 3You get the proposal in writing, with scope, timeline, and price.

Request your proposal
We reply during business hours (Bogotá time, UTC-5), usually the same day.